# 条形图
# 最基础版
//<script type="text/javascript" src="https://d3js.org/d3.v5.min.js"></script>
function create(width,height,rectWidth,rectPadding,padding,dataset){
	var svg = d3.select("body")
	.append("svg")
	.attr("width", width)
	.attr("height", height)

	//定义矩形比例尺

	var yScale=d3.scaleLinear()
	.domain([0,d3.max(dataset)])
	.range([height-padding.top-padding.bottom,0]);
	var yAxis=d3.axisLeft().scale(yScale).ticks(5);
	// var yAxis=d3.axisLeft(yScale).ticks(5);
	svg.append("g")
	.attr("transform",`translate(${padding.top},${padding.left})`)
	.call(yAxis);

	var xScale=d3.scaleBand()
	.domain(d3.range(dataset.length))
	.rangeRound([0,dataset.length*(rectWidth+(rectPadding/2))]);
	var xAxis=d3.axisBottom(xScale)
	.ticks(5);
	svg.append("g")
	.attr("transform",`translate(${padding.left},${height-padding.top})`)
	.call(xAxis);

	//定义矩形
	var g=d3.selectAll("svg")
	.append("g")
	.attr("transform",`translate(${padding.top},${padding.left})`);

	var graph=g.selectAll("rect")
	.data(dataset)
	.enter()
	.append("g");

	graph.append("rect")
	.style("fill","#30dc76")
	.attr("x",function (d,i) {
	    return (i*rectWidth)+(i+1)*(rectPadding/2);
	})
	.attr("width",rectWidth-rectPadding/2)
	.attr("y",function (d) {
	    var min=yScale.domain()[0];
	    return yScale(min);
	})
	.attr("height",function(d,i){
	    return 0;
	})
	.transition()
	.duration(2000)
	.delay(function(d,i){
	    return i*40;
	})
	//.ease(d3.easeBackOut)
	.attr("y",function (d,i) {
	    return yScale(d)
	})
	.attr("height",function (d,i) {
	    return height-padding.top-padding.bottom-yScale(d);
	})

	graph.append("text")
	.style("fill", "orange")
	.attr("x", function (d, i) {
	    return (i * rectWidth) + (i + 1) * (rectPadding / 2);
	})
	.attr("dx", 10)
	.attr("dy",-10)
	.attr("y", function (d) {
	    var min = d3.min(dataset);
	    return yScale(min)
	})
	.text(function (d) {
	    return d
	})
	.transition()
	.duration(2000)
	.delay(function (d, i) {
	    return i * 40;
	})
	.attr("y", function (d, i) {
	    return yScale(d);
	})
}
//参数 svg宽,高,矩形宽度,间隔,svgpadding,要插入的数据
create(600,600,50,10,{top:40,bottom:40,left:40,right:40},[45, 70, 12, 79, 4, 127, 33, 150])
# 条形图修改
<html>
<style>
body {
font-family: 'Open Sans', sans-serif;
}
div#layout {
text-align: center;
}
div#container {
width: 1000px;
height: 600px;
margin: auto;
background-color: #2F4A6D;
}
svg {
width: 100%;
height: 100%;
}
text {
font-size: 12px;
fill: #fff;
}
path {
stroke: gray;
}
line {
stroke: gray;
}
line#limit {
stroke: #FED966;
stroke-width: 3;
stroke-dasharray: 3 6;
}
.grid path {
stroke-width: 0;
}
.grid .tick line {
stroke: #9FAAAE;
stroke-opacity: 0.3;
}
text.divergence {
font-size: 14px;
fill: #2F4A6D;
}
text.value {
font-size: 14px;
}
text.title {
font-size: 22px;
font-weight: 600;
}
text.label {
font-size: 14px;
font-weight: 400;
}
text.source {
font-size: 10px;
}
</style>
<body>
<div id='layout'>
<!-- <h2>Bar chart example</h2> -->
<div id='container'>
<svg />
</div>
</div>
</body>
<script src="https://d3js.org/d3.v5.min.js"></script>
<script>
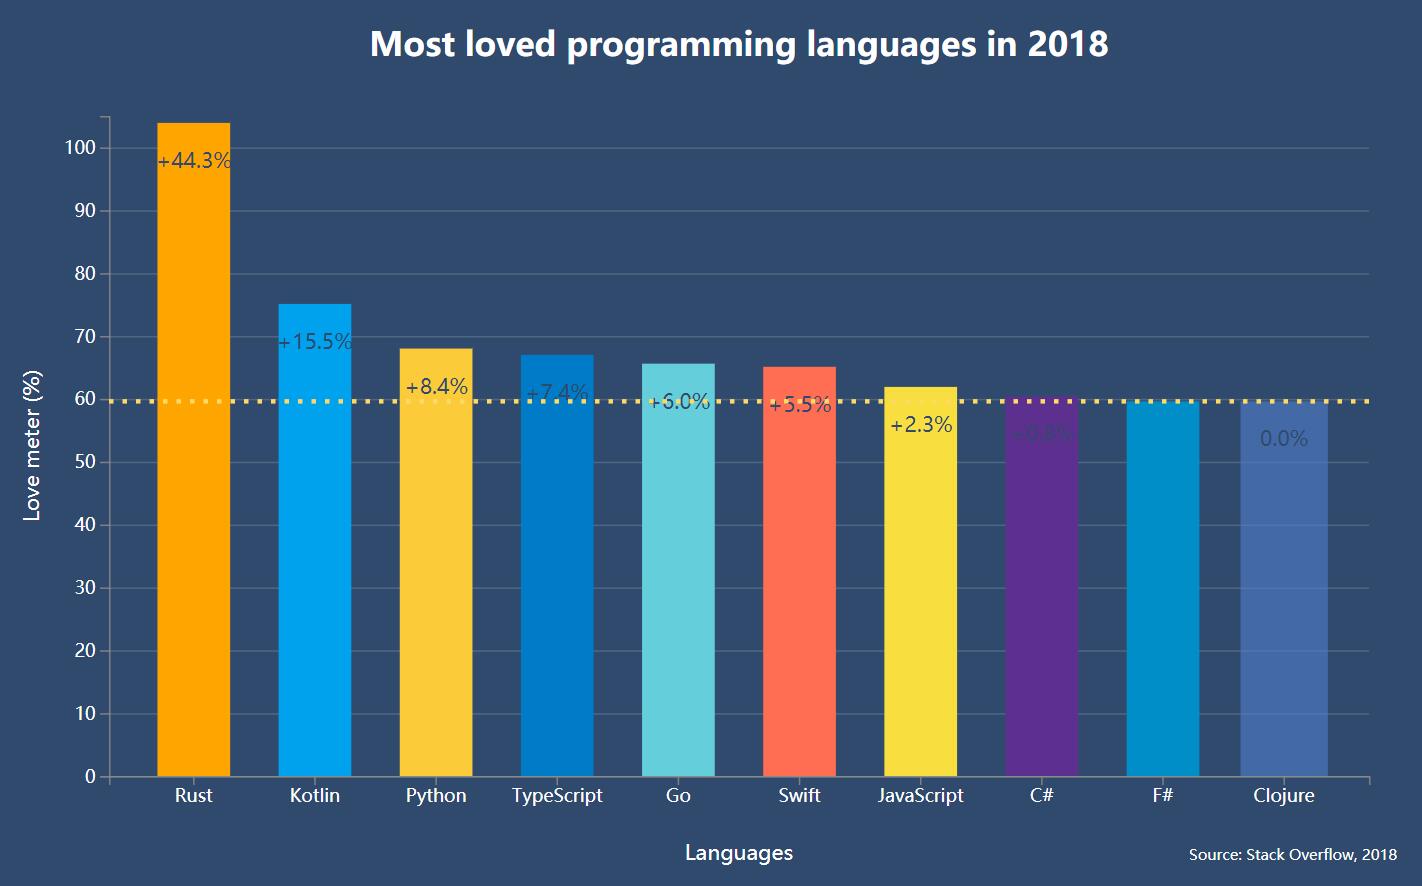
const sample = [
{
language: 'Rust',
value: 103.9,
color: 'orange'
},
{
language: 'Kotlin',
value: 75.1,
color: '#00a2ee'
},
{
language: 'Python',
value: 68.0,
color: '#fbcb39'
},
{
language: 'TypeScript',
value: 67.0,
color: '#007bc8'
},
{
language: 'Go',
value: 65.6,
color: '#65cedb'
},
{
language: 'Swift',
value: 65.1,
color: '#ff6e52'
},
{
language: 'JavaScript',
value: 61.9,
color: '#f9de3f'
},
{
language: 'C#',
value: 60.4,
color: '#5d2f8e'
},
{
language: 'F#',
value: 59.6,
color: '#008fc9'
},
{
language: 'Clojure',
value: 59.6,
color: '#507dca'
}
];
const svg = d3.select('svg');
const svgContainer = d3.select('#container');
const margin = 80;
const width = 1000 - 2 * margin;
const height = 600 - 2 * margin;
const chart = svg.append('g')
.attr('transform', `translate(${margin}, ${margin})`);
const xScale = d3.scaleBand()
.range([0, width])
.domain(sample.map((s) => s.language))
.padding(0.4)
const yScale = d3.scaleLinear()
.range([height, 0])
.domain([0, 105]);
const makeYLines = () => d3.axisLeft()
.scale(yScale)
chart.append('g')
.attr('transform', `translate(0, ${height})`)
.call(d3.axisBottom(xScale));
chart.append('g')
.call(d3.axisLeft(yScale));
chart.append('g')
.attr('class', 'grid')
.call(makeYLines()
.tickSize(-width, 0, 0)
.tickFormat('')
)
const barGroups = chart.selectAll()
.data(sample)
.enter()
.append('g')
barGroups
.append('rect')
.attr('class', 'bar')
.attr('x', (g) => xScale(g.language))
.attr('y', (g) => 440)
.attr("height",()=>0)
.attr('width', xScale.bandwidth())
.attr("fill",(g)=>{return g.color})
.transition()
.delay(function(d,i){
return i*200;
})
.duration(2000)
.attr('height', (g) => height - yScale(g.value))
.attr('y', (g) => yScale(g.value))
d3.selectAll("rect")
.on('mouseenter', function (actual, i) {
d3.selectAll('.value')
.attr('opacity', 0)
d3.select(this)
.transition()
.duration(300)
.attr('opacity', 0.6)
.attr('x', (a) => xScale(a.language) - 5)
.attr('width', xScale.bandwidth() + 10)
const y = yScale(actual.value)
line = chart.append('line')
.attr('id', 'limit')
.attr('x1', 0)
.attr('y1', y)
.attr('x2', width)
.attr('y2', y)
barGroups.append('text')
.attr('class', 'divergence')
.attr('x', (a) => xScale(a.language) + xScale.bandwidth() / 2)
.attr('y', (a) => yScale(a.value) + 30)
.attr('fill', 'white')
.attr('text-anchor', 'middle')
.text((a, idx) => {
const divergence = (a.value - actual.value).toFixed(1)
let text = ''
if (divergence > 0) text += '+'
text += `${divergence}%`
return idx !== i ? text : '';
})
})
.on('mouseleave', function() {
d3.selectAll('.value')
.attr('opacity', 1)
d3.select(this)
.transition()
.duration(300)
.attr('opacity', 1)
.attr('x', (a) => xScale(a.language))
.attr('width', xScale.bandwidth())
chart.selectAll('#limit').remove()
chart.selectAll('.divergence').remove()
})
barGroups
.append('text')
.attr('class', 'value')
.attr('x', (a) => xScale(a.language) + xScale.bandwidth() / 2)
.attr('y', (a) => 420)
.attr('text-anchor', 'middle')
.transition()
.delay(function(d,i){
return i*200;
})
.duration(2000)
.attr('y', (a) => yScale(a.value) + 30)
.text((a) => `${a.value}%`)
svg
.append('text')
.attr('class', 'label')
.attr('x', -(height / 2) - margin)
.attr('y', margin / 2.4)
.attr('transform', 'rotate(-90)')
.attr('text-anchor', 'middle')
.text('Love meter (%)')
svg.append('text')
.attr('class', 'label')
.attr('x', width / 2 + margin)
.attr('y', height + margin * 1.7)
.attr('text-anchor', 'middle')
.text('Languages')
svg.append('text')
.attr('class', 'title')
.attr('x', width / 2 + margin)
.attr('y', 40)
.attr('text-anchor', 'middle')
.text('Most loved programming languages in 2018')
svg.append('text')
.attr('class', 'source')
.attr('x', width - margin / 2)
.attr('y', height + margin * 1.7)
.attr('text-anchor', 'start')
.text('Source: Stack Overflow, 2018')
</script>
</html>
# 总结
- path修改的是刻度尺的线条
path {
  stroke: gray;
}
- line则是修改刻度尺上刻度的样式
line {
  stroke: gray;
}
- stroke-width控制线条宽度 stroke-dasharray控制虚线样式 stroke-opacity控制透明度 stroke-dashoffset偏移量
line#limit {
  stroke: #FED966;
  stroke-width: 3;
  stroke-dasharray: 3 6;
  stroke-dashoffset: 60
}

.grid .tick line {
  stroke: #9FAAAE;
  stroke-opacity: 0.3;
}
- text-anchor 文本锚点属性被用来描述该文本与所给点的对齐方式 (开头、中间、末尾对齐)
- 矩形宽度
const xScale = d3.scaleBand()
      .range([0, width])
      .domain(sample.map((s) => s.language))
      .padding(0.4)
console.log(xScale.bandwidth(),xScale.paddingInner(),xScale.paddingOuter())