# d3实例
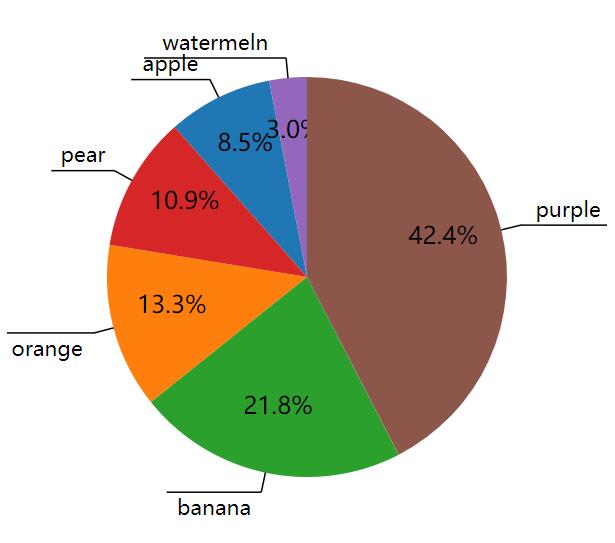
# 柱状图实例
<!DOCTYPE html>
<html>
	<head>
		<meta charset="utf-8" />
		<meta name="viewport" content="width=device-width, initial-scale=1">
		<title></title>
		<style>
			*{margin:0;padding:0}
		</style>
	</head>
	<body>
	</body>
	<script type="text/javascript" src="https://d3js.org/d3.v5.min.js"></script>
	<script type="text/javascript">


var dataset = [45, 70, 12, 79, 4, 127, 33, 150];
var width = 600;//svg画布宽
var height = 600;//svg画布高
var rectWidth = 50;//每个矩形的默认宽度
var rectPadding=10;//每个矩形间的间隔
var padding={top:40,bottom:40,left:40,right:40};//定义间隔
//定义画布
var svg = d3.select("body")
.append("svg")
.attr("width", width)
.attr("height", height)

//定义矩形比例尺

var yScale=d3.scaleLinear()
.domain([0,d3.max(dataset)])
.range([height-padding.top-padding.bottom,0]);
var yAxis=d3.axisLeft().scale(yScale).ticks(5);
var yAxis=d3.axisLeft(yScale).ticks(5);
svg.append("g")
.attr("transform",`translate(${padding.top},${padding.left})`)
.call(yAxis);

var xScale=d3.scaleBand()
.domain(d3.range(dataset.length))
.rangeRound([0,dataset.length*(rectWidth+(rectPadding/2))]);
var xAxis=d3.axisBottom(xScale)
.ticks(5);
svg.append("g")
.attr("transform",`translate(${padding.left},${height-padding.top})`)
.call(xAxis);

//定义矩形
var g=d3.selectAll("svg")
.append("g")
.attr("transform",`translate(${padding.top},${padding.left})`);

var graph=g.selectAll("rect")
.data(dataset)
.enter()
.append("g");

graph.append("rect")
.style("fill","#30dc76")
.attr("x",function (d,i) {
    return (i*rectWidth)+(i+1)*(rectPadding/2);
})
.attr("width",rectWidth-rectPadding/2)
.attr("y",function (d) {
    var min=yScale.domain()[0];
    return yScale(min);
})
.attr("height",function(d,i){
    return 0;
})
.transition()
.duration(2000)
.delay(function(d,i){
    return i*400;
})
//.ease(d3.easeBackOut)
.attr("y",function (d,i) {
    return yScale(d)
})
.attr("height",function (d,i) {
    return height-padding.top-padding.bottom-yScale(d);
})

graph.append("text")
.style("fill", "orange")
.attr("x", function (d, i) {
    return (i * rectWidth) + (i + 1) * (rectPadding / 2);
})
.attr("dx", 10)
.attr("dy",-10)
.attr("y", function (d) {
    var min = d3.min(dataset);
    return yScale(min)
})
.text(function (d) {
    return d
})
.transition()
.duration(2000)
.delay(function (d, i) {
    return i * 400;
})
.attr("y", function (d, i) {
    return yScale(d);
})


	</script>
</html>
var yAxis=d3.axisLeft().scale(yScale).ticks(5);
var yAxis=d3.axisLeft(yScale).ticks(5);
//两种写法效果一致!
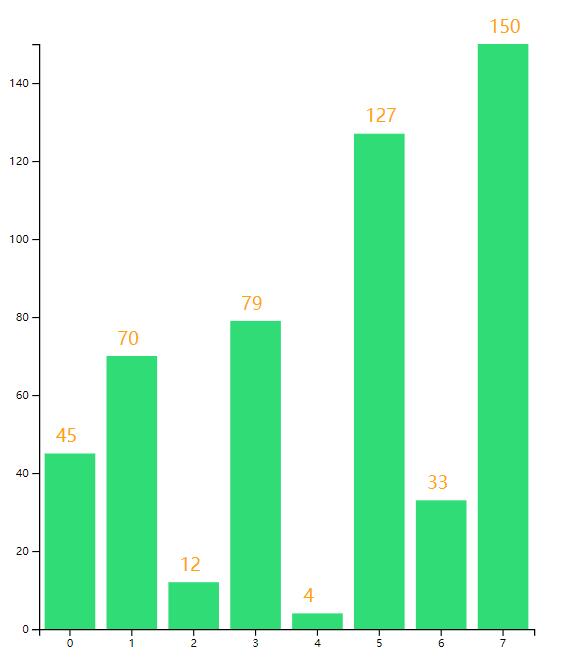
# 饼图
<!DOCTYPE html>
<html>
	<head>
		<meta charset="utf-8" />
		<meta name="viewport" content="width=device-width, initial-scale=1">
		<title></title>
		<style type="text/css">
			#a{
				width:100%;
				height:600px;
			}
		</style>
	</head>
	<body>
		<div id="a"></div>
	</body>
	<script src="https://d3js.org/d3.v5.min.js"></script>
	<script type="text/javascript">
	 let dataset=[["apple",14],["orange",22],["banana",36],["pear",18],["watermeln",5],["purple",70]]
	 pieChart("#a",dataset)
	 function pieChart(id, dataset) {
	  const width = 400;
	  const height = 400;
	  const fontsize = 14;
	  const svg = d3
		.select(id)
		.append('svg')
		.attr('width', width)
		.attr('height', height);

	  const pie = d3.pie().value(d => d[1]);
	  // dataset为转换前的数据 piedata为转换后的数据
	  const piedata = pie(dataset);

	  const outerRadius = width / 3;
	  const innerRadius = 0; // 内半径和外半径
	  // 创建弧生成器
	  const arc = d3
		.arc()
		.innerRadius(innerRadius)
		.outerRadius(outerRadius);
	  const color = d3.scaleOrdinal(d3.schemeCategory10);
	  // 添加对应数目的弧组
	  const arcs = svg
		.selectAll('g')
		.data(piedata)
		.enter()
		.append('g')
		.attr('transform', `translate(${width / 2},${height / 2})`);
	  // 添加弧的路径元素
	  arcs
		.append('path')
		.attr('fill', function(d, i) {
		  return color(i);
		})
		.attr('d', function(d) {
		  return arc(d); // 使用弧生成器获取路径
		});

	  // 添加弧内的文字
	  arcs
		.append('text')
		.attr('transform', function(d) {
		  const x = arc.centroid(d)[0] * 1.4; // 文字的x坐标
		  const y = arc.centroid(d)[1] * 1.4;
		  return `translate(${x},${y})`;
		})
		.attr('text-anchor', 'middle')
		.text(d => {
		  // 计算市场份额的百分比
		  const percent =
			(Number(d.value) /
			  d3.sum(dataset, a => {
				return a[1];
			  })) *
			100;
		  // 保留一位小数点 末尾加一个百分号返回
		  return `${percent.toFixed(1)}%`;
		});

	  // 添加连接弧外文字的直线元素
	  arcs
		.append('line')
		.attr('stroke', 'black')
		.attr('x1', d => {
		  return arc.centroid(d)[0] * 2;
		})
		.attr('y1', d => {
		  return arc.centroid(d)[1] * 2;
		})
		.attr('x2', d => {
		  return arc.centroid(d)[0] * 2.2;
		})
		.attr('y2', d => {
		  return arc.centroid(d)[1] * 2.2;
		});

	  arcs
		.append('line')
		.style('stroke', 'black')
		.each(d => {
		  d.textLine = {
			x1: 0,
			y1: 0,
			x2: 0,
			y2: 0,
		  };
		})
		.attr('x1', d => {
		  d.textLine.x1 = arc.centroid(d)[0] * 2.2;
		  return d.textLine.x1;
		})
		.attr('y1', d => {
		  d.textLine.y1 = arc.centroid(d)[1] * 2.2;
		  return d.textLine.y1;
		})
		.attr('x2', d => {
		  // console.log("d.data[0]:  "+d.data[0]);//产商名
		  const strLen = getPixelLength(d.data[0], fontsize) * 1.5;
		  const bx = arc.centroid(d)[0] * 2.2;
		  d.textLine.x2 = bx >= 0 ? bx + strLen : bx - strLen;
		  return d.textLine.x2;
		})
		.attr('y2', d => {
		  d.textLine.y2 = arc.centroid(d)[1] * 2.2;
		  return d.textLine.y2;
		});
	  arcs
		.append('text')
		.attr('transform', function(d) {
		  let x = 0;
		  let y = 0;
		  x = (d.textLine.x1 + d.textLine.x2) / 2;
		  y = d.textLine.y1;
		  y = y > 0 ? y + fontsize * 1.1 : y - fontsize * 0.4;
		  return `translate(${x},${y})`;
		})
		.style('text-anchor', 'middle')
		.style('font-size', fontsize)
		.text(function(d) {
		  return d.data[0];
		});
	  // 添加一个提示框
	  const tooltip = d3
		.select(id)
		.append('div')
		.attr('class', 'tooltip')
		.style('position', 'absolute')
		.style('background-color', '#fff')
		.style('opacity', 0);

	  // 添加提示框
	  arcs
		.on('mouseover', function(d, i) {
		  tooltip
			.html(`${d.data[0]}的销量为<br />${d.data[1]} 吨`)
			.style('left', `${d3.event.pageX}px`)
			.style('top', `${d3.event.pageY + 20}px`)
			.style('opacity', 1.0)
			.style('box-shadow', `10px 0px 0px${color(i)}`); // 在提示框后添加阴影
		})
		.on('mousemove', () => {
		  tooltip.style('left', `${d3.event.pageX}px`).style('top', `${d3.event.pageY + 20}px`);
		})
		.on('mouseout', () => {
		  // 鼠标移除 透明度设为0
		  tooltip.style('opacity', 0.0);
		});
	}
	function getPixelLength(str, fontsize) {
	  let curLen = 0;
	  for (let i = 0; i < str.length; i += 1) {
		const code = str.charCodeAt(i);
		const pixelLen = code > 255 ? fontsize : fontsize / 2;
		curLen += pixelLen;
	  }
	  return curLen;
	}

	</script>
</html>