# d3实例
| api | 作用 | 例子 |
|---|---|---|
| d3.arc() | 生成一个弧。 您需要为弧设置内半径和外半径。 如果内半径为0,则结果将为饼图,否则结果将为圆环图 | d3.arc().outerRadius(radius - 10).innerRadius(0) |
| d3.pie() | 生成饼图。 它从数据集中获取数据并计算饼图的每个楔形的起始角度和结束角度。 | - |
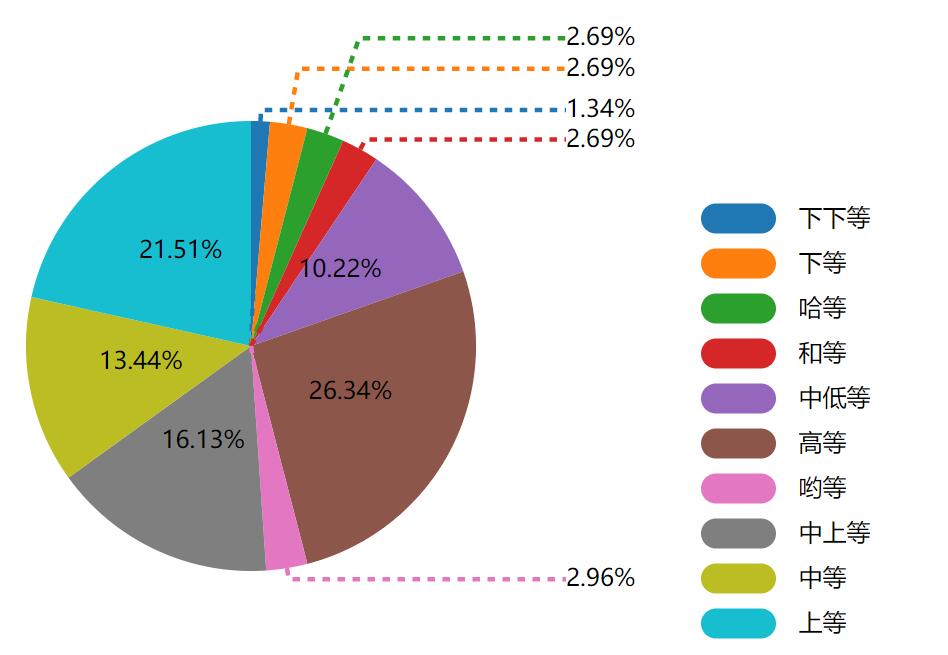
# 环形图实例
<html>
	<body></body>
	<style>
		div {
			background: #F2F4FF;
			width: 100px;
			height: 40px;
			position: absolute;
			opacity: 0;
			text-align: center;
			font-size: 12px;
			line-height: 40px;
		}
	</style>
	<script src="https://d3js.org/d3.v5.min.js"></script>
	<script>
		// 数据准备
		let data = [{
			label: '下下等',
			num: 5
		}, {
			label: '下等',
			num: 10
		}, {
			label: '哈等',
			num: 10
		}, {
			label: '和等',
			num: 10
		}, {
			label: '中低等',
			num: 38
		}, {
			label: '高等',
			num: 98
		}, {
			label: '哟等',
			num: 11
		}, {
			label: '中上等',
			num: 60
		}, {
			label: '中等',
			num: 50
		}, {
			label: '上等',
			num: 80
		}];
		let marge = {
			top: 0,
			right: 60,
			bottom: 60,
			left: 0
		};
		let width = 1000,
			height = 800;
		// 弧形生成器内、外半径
		let innerRadius = 0,
			outerRadius = 150;
		let svg = d3.select('body').append('svg').attr('width', width).attr('height', height);
		let g = svg.append('g').attr('transform', 'translate(' + marge.left + ',' + marge.top + ')');

		// 颜色比例尺
		let colorScale = d3.scaleOrdinal().domain(d3.range(data.length))
			.range(d3.schemeCategory10);
		// 创建饼状图
		let pie = d3.pie().value(function(d) {
			return d.num
		}).sort(null);
		// 创建弧形生成器
		let arc = d3.arc().innerRadius(innerRadius).outerRadius(outerRadius);
		let arc2 = d3.arc().innerRadius(innerRadius).outerRadius(outerRadius + 20);
		// 饼状图生成器转换数据
		let pieData = pie(data);
		// 开始绘制,先为每个扇形及其对应的文字建立一个分组<g>
		let arcs = g.selectAll('.g').data(pieData).enter().append('g').attr('cursor', 'pointer')
			.attr('transform', 'translate(' + width / 2 + ',' + height / 2 + ')');
		// 绘制饼状图的各个扇形
		arcs.append('path')
			.transition()
			.delay(0)
			.duration(500)
			//.each(d3.easeBounceInOut)
			.attrTween('d', function(d, i) {
				let interpolate = d3.interpolate(d.startAngle, d.endAngle);
				return function(t) {
					d.endAngle = interpolate(t);
					return arc(d);
				}
			})
			.attr('fill', function(d, i) {
				d.color = colorScale(i);
				return d.color;
			});
		// 绘制饼状图上的文字信息
		arcs.append('text')
			.attr('transform', function(d) {
				return 'translate(' + arc.centroid(d) + ')';
			})
			.attr('text-anchor', 'middle')
			.text(function(d) {
				// 文字不超过扇形能容纳的长度才将其显示
				if (getStrLen(d.data.label) < (outerRadius / 2) * Math.sin(d.endAngle - d.startAngle)) {
					return ((d.endAngle - d.startAngle) / 6.283185307179586 * 100).toFixed(2) + '%';
				}
			});
		// 图注个数
		let count = 0;
		let before = 0;
		// 图注文字
		let text = svg.selectAll(".text")
			.data(pieData) //返回是pie(data0)
			.enter().append("g")
			.attr("transform", "translate(" + width / 2 + "," + height / 2 + ")")
			.append("text")
			.style('text-anchor', function(d, i) {
				//根据文字在是左边还是右边,在右边文字是start,文字默认都是start。
				return (d.startAngle + d.endAngle) / 2 < Math.PI ? 'start' : 'end';
			})
			.attr('transform', function(d, i) {
				var pos = arc.centroid(d); //centroid(d)计算弧中心
				pos[0] = outerRadius * ((d.startAngle + d.endAngle) / 2 < Math.PI ? 1.4 : -1.4);
				if (overRange(d)) {
					if (before == 0) before = pos[1];
					pos[1] *= (2.1 + count * 0.4); //将文字移动到外面去。
					// 超出将count(图注数量)自加
					count++;
					if (count > 2) count = before = 0;
				} else {
					count = before = 0;
				}
				return 'translate(' + pos + ')';
			})
			.attr("dy", ".3em") //将文字向下平移.3em
			.text(function(d) { //设置文本
				// 如果文本长度超过扇形长度,则才显示图注
				if (overRange(d)) {
					return ((d.endAngle - d.startAngle) / 6.283185307179586 * 100).toFixed(2) + '%';
				}
				return '';
			});

		count = 0; // 重置
		// 图注连线
		let line = svg.selectAll(".line") //添加文字和弧之间的连线
			.data(pieData) //返回是pie(data0)
			.enter().append("g")
			.attr("transform", "translate(" + width / 2 + "," + height / 2 + ")")
			.append("polyline")
			.attr('points', function(d, i) {
				var pos1 = arc.centroid(d),
					pos2 = arc.centroid(d),
					pos3 = arc.centroid(d);
				// 如果文本长度超过扇形长度,则才显示图注
				if (overRange(d)) {
					pos1[0] *= 0, pos1[1] *= 0;
					pos2[0] *= (2.1 + count * 0.4), pos2[1] *= (2.1 + count * 0.4);
					pos3[0] = outerRadius * ((d.startAngle + d.endAngle) / 2 < Math.PI ? 1.4 : -1.4);
					pos3[1] *= (2.1 + count * 0.4);
					count++;
					if (count > 2) {
						before = pos2[1];
						count = 0;
					}
					//pos2是从圆弧出来到长直虚线的长度,pos3就是将pos2平移后得到的位置
					//三点链接在一起就成了线段。
					return [pos1, pos2, pos3];
				} else {
					before = pos2[1];
					count = 0;
				}
			})
			.style('fill', 'none')
			.style('stroke', function(d, i) {
				return d.color;
			})
			.style('stroke-width', "3px")
			.style('stroke-dasharray', "5px");

		let label = svg.selectAll('.label') //添加右上角的标签
			.data(pieData)
			.enter()
			.append('g')
			.attr("transform", "translate(" + (width / 2 + outerRadius * 2) + "," + 10 + ")");
		label.append('rect') //标签中的矩形
			.style('fill', function(d, i) {
				return colorScale(i);
			})
			.attr('x', 0)
			.attr("y", function(d, i) {
				return (height - outerRadius) / 2 + (i - 1) * 30;
			})
			.attr('rx', '10') //rx=ry 会出现圆角
			.attr('ry', '10')
			.attr('width', 50)
			.attr('height', 20);
		label.append('text') //标签中的文字
			.attr('x', function(d, i) {
				return 65; //因为rect宽度是50,所以把文字偏移15,在后面再将文字设置居中
			})
			.attr("y", function(d, i) {
				return (height - outerRadius) / 2 + 15 + (i - 1) * 30;
			})
			.text(function(d) {
				return d.data.label;
			})
			.style({
				"font-size": "10px",
				"text-anchor": "middle",
				'fill': "white",
				"font-weight": 600
			});


		// 文字是否超出扇形区域(超出返回true,不超出返回false)
		function overRange(d) {
			// 扇形长度(不是弧长,是从扇形左边的中间位置引出的一条水平线与右边相交的直线长度)
			// 计算公式:扇形半径/2 * sin(弧度)
			let length = (outerRadius / 2) * Math.sin(d.endAngle - d.startAngle);
			// 字符串长度
			let len = getStrLen(d.data.label);
			if (len >= length) {
				return true;
			}
			return false;
		}
		// 悬浮提示框
		let tooltip = d3.select('body').append('div');

		arcs.on('mouseover', function() {
			let label;
			d3.select(this).select('path').transition().attr('d', function(d) {
				label = d.data.label;
				return arc2(d);
			});
			// 悬浮在直方图上时,显示提示框
			tooltip.html(label).transition().duration(500).style('left', d3.event.pageX - 20)
				.style('top', d3.event.pageY + 20).style('opacity', 1.0);
		});
		arcs.on('mouseout', function() {
			d3.select(this).select('path').transition().attr('d', function(d) {
				return arc(d);
			});
			// 隐藏悬浮框
			tooltip.transition().style('opacity', 0);
		});

		// 获取字符串所占像素
		function getStrLen(val) {
			var len = 0;
			for (var i = 0; i < val.length; i++) {
				var length = val.charCodeAt(i);
				if (length >= 0 && length <= 128) {
					len += 1;
				} else {
					len += 2;
				}
			}
			return len * 7.1;
		}
	</script>
</html>
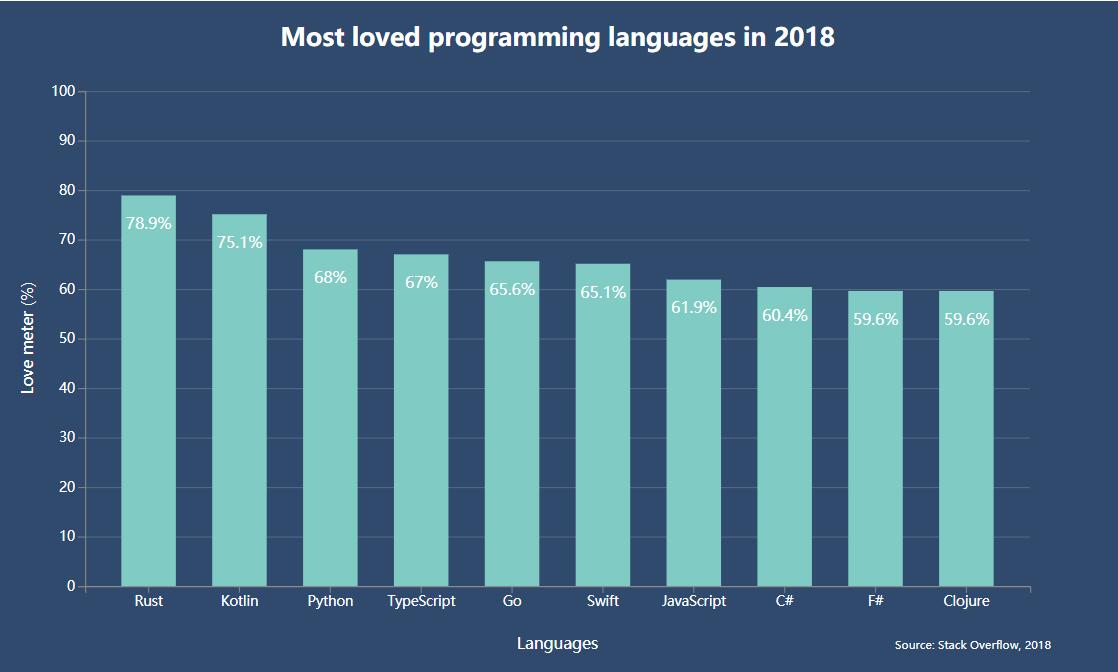
# 柱状图实例
<html>

	<style>

		body {
		  font-family: 'Open Sans', sans-serif;
		}

		div#layout {
		  text-align: center;
		}

		div#container {
		  width: 1000px;
		  height: 600px;
		  margin: auto;
		  background-color: #2F4A6D;
		}

		svg {
		  width: 100%;
		  height: 100%;
		}

		.bar {
		  fill: #80cbc4;
		}

		text {
		  font-size: 12px;
		  fill: #fff;
		}

		path {
		  stroke: gray;
		}

		line {
		  stroke: gray;
		}

		line#limit {
		  stroke: #FED966;
		  stroke-width: 3;
		  stroke-dasharray: 3 6;
		}

		.grid path {
		  stroke-width: 0;
		}

		.grid .tick line {
		  stroke: #9FAAAE;
		  stroke-opacity: 0.3;
		}

		text.divergence {
		  font-size: 14px;
		  fill: #2F4A6D;
		}

		text.value {
		  font-size: 14px;
		}

		text.title {
		  font-size: 22px;
		  font-weight: 600;
		}

		text.label {
		  font-size: 14px;
		  font-weight: 400;
		}

		text.source {
		  font-size: 10px;
		}
	</style>
	<body>
		<div id='layout'>
	  <!-- <h2>Bar chart example</h2> -->
	  <div id='container'>
	    <svg />
	  </div>
	</div>
		</body>
	<script src="https://d3js.org/d3.v5.min.js"></script>
	<script>
	const sample = [
    {
      language: 'Rust',
      value: 78.9,
      color: '#000000'
    },
    {
      language: 'Kotlin',
      value: 75.1,
      color: '#00a2ee'
    },
    {
      language: 'Python',
      value: 68.0,
      color: '#fbcb39'
    },
    {
      language: 'TypeScript',
      value: 67.0,
      color: '#007bc8'
    },
    {
      language: 'Go',
      value: 65.6,
      color: '#65cedb'
    },
    {
      language: 'Swift',
      value: 65.1,
      color: '#ff6e52'
    },
    {
      language: 'JavaScript',
      value: 61.9,
      color: '#f9de3f'
    },
    {
      language: 'C#',
      value: 60.4,
      color: '#5d2f8e'
    },
    {
      language: 'F#',
      value: 59.6,
      color: '#008fc9'
    },
    {
      language: 'Clojure',
      value: 59.6,
      color: '#507dca'
    }
];

const svg = d3.select('svg');
const svgContainer = d3.select('#container');

const margin = 80;
const width = 1000 - 2 * margin;
const height = 600 - 2 * margin;

const chart = svg.append('g')
      .attr('transform', `translate(${margin}, ${margin})`);

const xScale = d3.scaleBand()
      .range([0, width])
      .domain(sample.map((s) => s.language))
      .padding(0.4)

const yScale = d3.scaleLinear()
      .range([height, 0])
      .domain([0, 100]);

const makeYLines = () => d3.axisLeft()
      .scale(yScale)

chart.append('g')
     .attr('transform', `translate(0, ${height})`)
     .call(d3.axisBottom(xScale));

chart.append('g')
     .call(d3.axisLeft(yScale));

chart.append('g')
     .attr('class', 'grid')
     .call(makeYLines()
        .tickSize(-width, 0, 0)
        .tickFormat('')
     )

const barGroups = chart.selectAll()
      .data(sample)
      .enter()
      .append('g')

barGroups
   .append('rect')
   .attr('class', 'bar')
   .attr('x', (g) => xScale(g.language))
   .attr('y', (g) => yScale(g.value))
   .attr('height', (g) => height - yScale(g.value))
   .attr('width', xScale.bandwidth())
   .on('mouseenter', function (actual, i) {
      d3.selectAll('.value')
        .attr('opacity', 0)

      d3.select(this)
        .transition()
        .duration(300)
        .attr('opacity', 0.6)
        .attr('x', (a) => xScale(a.language) - 5)
        .attr('width', xScale.bandwidth() + 10)

      const y = yScale(actual.value)

            line = chart.append('line')
              .attr('id', 'limit')
              .attr('x1', 0)
              .attr('y1', y)
              .attr('x2', width)
              .attr('y2', y)

      barGroups.append('text')
          .attr('class', 'divergence')
          .attr('x', (a) => xScale(a.language) + xScale.bandwidth() / 2)
          .attr('y', (a) => yScale(a.value) + 30)
          .attr('fill', 'white')
          .attr('text-anchor', 'middle')
          .text((a, idx) => {
            const divergence = (a.value - actual.value).toFixed(1)

            let text = ''
            if (divergence > 0) text += '+'
            text += `${divergence}%`

            return idx !== i ? text : '';
          })
    })
   .on('mouseleave', function() {
      d3.selectAll('.value')
        .attr('opacity', 1)
      d3.select(this)
        .transition()
        .duration(300)
        .attr('opacity', 1)
        .attr('x', (a) => xScale(a.language))
        .attr('width', xScale.bandwidth())

      chart.selectAll('#limit').remove()
      chart.selectAll('.divergence').remove()
   })

barGroups
      .append('text')
      .attr('class', 'value')
      .attr('x', (a) => xScale(a.language) + xScale.bandwidth() / 2)
      .attr('y', (a) => yScale(a.value) + 30)
      .attr('text-anchor', 'middle')
      .text((a) => `${a.value}%`)

    svg
      .append('text')
      .attr('class', 'label')
      .attr('x', -(height / 2) - margin)
      .attr('y', margin / 2.4)
      .attr('transform', 'rotate(-90)')
      .attr('text-anchor', 'middle')
      .text('Love meter (%)')

    svg.append('text')
      .attr('class', 'label')
      .attr('x', width / 2 + margin)
      .attr('y', height + margin * 1.7)
      .attr('text-anchor', 'middle')
      .text('Languages')

    svg.append('text')
      .attr('class', 'title')
      .attr('x', width / 2 + margin)
      .attr('y', 40)
      .attr('text-anchor', 'middle')
      .text('Most loved programming languages in 2018')

    svg.append('text')
      .attr('class', 'source')
      .attr('x', width - margin / 2)
      .attr('y', height + margin * 1.7)
      .attr('text-anchor', 'start')
      .text('Source: Stack Overflow, 2018')
	</script>
</html>
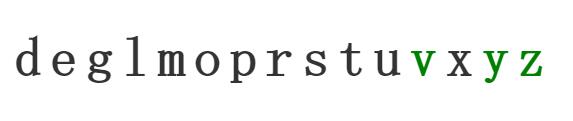
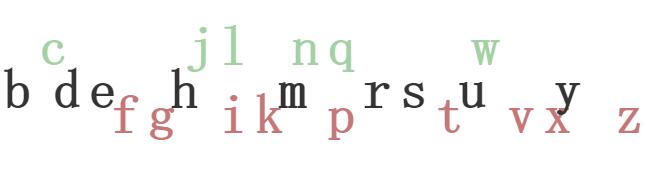
# 字节跳动实例
<!DOCTYPE html>
<meta charset="utf-8">
<style>

text {
  font: bold 48px monospace;
}

.enter {
  fill: green;
}

.update {
  fill: #333;
}

.exit {
  fill: brown;
}

</style>
<svg width="960" height="500"></svg>
<script src="https://d3js.org/d3.v4.min.js"></script>
<script>

var alphabet = "abcdefghijklmnopqrstuvwxyz".split("");

var svg = d3.select("svg"),
    width = +svg.attr("width"),
    height = +svg.attr("height"),
    g = svg.append("g").attr("transform", "translate(32," + (height / 2) + ")");

function update(data) {
  var t = d3.transition()
      .duration(750);

  // JOIN new data with old elements.
  var text = g.selectAll("text")
    .data(data, function(d) { return d; });

  // EXIT old elements not present in new data.
  text.exit()
      .attr("class", "exit")
    .transition(t)
      .attr("y", 60)
      .style("fill-opacity", 1e-6)
      .remove();

  // UPDATE old elements present in new data.
  text.attr("class", "update")
      .attr("y", 0)
      .style("fill-opacity", 1)
    .transition(t)
      .attr("x", function(d, i) { return i * 32; });

  // ENTER new elements present in new data.
  text.enter().append("text")
      .attr("class", "enter")
      .attr("dy", ".35em")
      .attr("y", -60)
      .attr("x", function(d, i) { return i * 32; })
      .style("fill-opacity", 1e-6)
      .text(function(d) { return d; })
    .transition(t)
      .attr("y", 0)
      .style("fill-opacity", 1);
}

// The initial display.
update(alphabet);

// Grab a random sample of letters from the alphabet, in alphabetical order.
d3.interval(function() {
  update(d3.shuffle(alphabet)
      .slice(0, Math.floor(Math.random() * 26))
      .sort());
}, 1500);

</script>
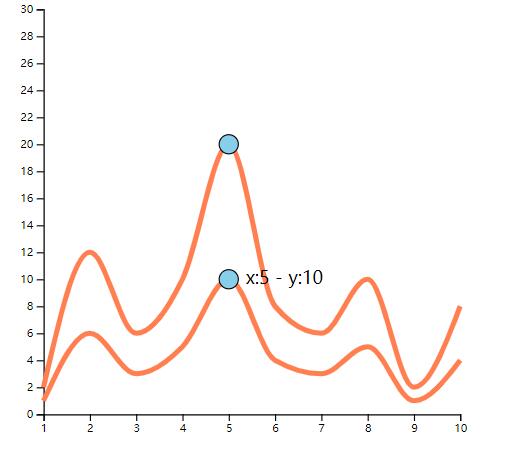
# 曲线图实例
<!DOCTYPE html>
<head>
  <meta charset="utf-8">
  <script src="https://d3js.org/d3.v5.min.js"></script>
  <style>
    body { margin:0;position:fixed;top:0;right:0;bottom:0;left:0; }
  </style>
</head>

<body>
  <div id="my_dataviz"></div>
  <script>


// set the dimensions and margins of the graph
var margin = {top: 10, right: 30, bottom: 30, left: 60},
    width = 460 - margin.left - margin.right,
    height = 400 - margin.top - margin.bottom;

// append the svg object to the body of the page
var svg = d3.select("#my_dataviz")
  .append("svg")
    .attr("width", width + margin.left + margin.right)
    .attr("height", height + margin.top + margin.bottom)
  .append("g")
    .attr("transform",
          "translate(" + margin.left + "," + margin.top + ")");

//Read the data
d3.csv("https://raw.githubusercontent.com/jwilber/random_data/master/tweets.csv").then((data) => {

  // Add X scale
  var xs = d3.scaleLinear()
    .domain([1,10])
    .range([ 0, width ]);
  svg.append("g")
    .attr("transform", "translate(0," + height + ")")
    .call(d3.axisBottom(xs));


  // Add Y scale
  var ys = d3.scaleLinear()
    .domain([0, 30])
    .range([ height, 0 ]);
  svg.append("g")
    .call(d3.axisLeft(ys));

  // define line generator
  var line = d3.line()
    .x(function(d, i) {
      return xs(d.day);
    }) // set the x values for the line generator
    .y(function(d) { return ys(d.tweets); }) // set the y values for the line generator
    .curve(d3.curveMonotoneX)

  var line2 = d3.line()
    .x(function(d, i) {
      return xs(d.day);
    }) // set the x values for the line generator
    .y(function(d) { return ys(d.tweets * 2); }) // set the y values for the line generator
    .curve(d3.curveMonotoneX)

  svg
    .append("path")
    .datum(data)
  	.attr('fill', 'none')
    .attr("stroke", "coral")
    .attr("stroke-width", 4.5)
    .attr("d", line)

  svg
    .append("path")
    .datum(data)
  	.attr('fill', 'none')
    .attr("stroke", "coral")
    .attr("stroke-width", 4.5)
    .attr("d", line2)


//   This allows to find the closest X index of the mouse:
  var bisect = d3.bisector(d => d.day).left;

//   // Create the circle that travels along the curve of chart
  var focus = svg
    .append('g')
    .append('circle')
      .style("fill", "skyblue")
      .attr("stroke", "black")
      .attr('r', 8.5)
      .style("opacity", 0)
  var focus2 = svg
    .append('g')
    .append('circle')
      .style("fill", "skyblue")
      .attr("stroke", "black")
      .attr('r', 8.5)
      .style("opacity", 0)

//   // Create the text that travels along the curve of chart
  var focusText = svg
    .append('g')
    .append('text')
      .style("opacity", 0)
      .attr("text-anchor", "left")
      .attr("alignment-baseline", "middle")

//   // Create a rect on top of the svg area: this rectangle recovers mouse position
  svg
    .append('rect')
    .style("fill", "none")
    .style("pointer-events", "all")
    .attr('width', width)
    .attr('height', height)
    .on('mouseover', mouseover)
    .on('mousemove', mousemove)
    .on('mouseout', mouseout);

 // What happens when the mouse move -> show the annotations at the right positions.
  function mouseover() {
    focus.style("opacity", 1)
    focus2.style('opacity', 1)
    focusText.style("opacity",1)
  }

  function mousemove() {
    // recover coordinate we need
    var x0 = xs.invert(d3.mouse(this)[0]);
    var i = bisect(data, x0, 1);
    selectedData = data[i]
    focus
      .attr("cx", xs(selectedData.day))
      .attr("cy", ys(selectedData.tweets))
    focus2
      .attr("cx", xs(selectedData.day))
      .attr("cy", ys(2* selectedData.tweets))
    focusText
      .html("x:" + selectedData.day + "  -  " + "y:" + selectedData.tweets)
      .attr("x", xs(selectedData.day)+15)
      .attr("y", ys(selectedData.tweets))
    }
  function mouseout() {
    focus.style("opacity", 0)
    focusText.style("opacity", 0)
  }


})
  </script>
</body>
day,tweets,retweets,favorites
1,1,2,5
2,6,11,3
3,3,8,1
4,5,14,6
5,10,29,16
6,4,22,10
7,3,14,1
8,5,18,7
9,1,30,22
10,4,16,15
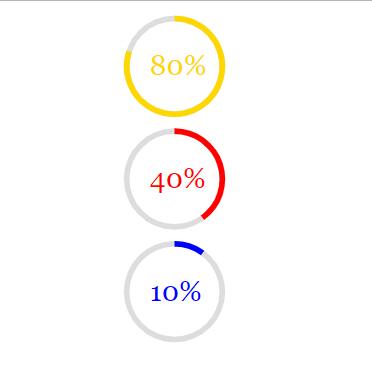
# 完成率实例
<!DOCTYPE html>
<meta charset="utf-8">
<body>
  <style>
    text {
			font-family: Georgia, Arial, sans-serif;
      font-size: 25px;
      fill: black;
    }

    .gold {
      fill: gold;
    }

    .blue {
      fill: blue;
    }

    .red {
      fill: red;
    }
  </style>
 <script src="https://d3js.org/d3.v5.min.js"></script>

<script>

var width = 500,
    height = 300,
    pie = 2 * Math.PI; // http://tauday.com/tau-manifesto

// An arc function with all values bound except the endAngle. So, to compute an
// SVG path string for a given angle, we pass an object with an endAngle
// property to the `arc` function, and it will return the corresponding string.


var arc = d3.arc()
    .innerRadius(40)
    .outerRadius(45)
    .startAngle(0);

// Create the SVG container, and apply a transform such that the origin is the
// center of the canvas. This way, we don't need to position arcs individually.
var svg = d3.select("body").append("svg")
    .attr("width", width)
    .attr("height", height);

var rings = [{id:"gold", percent: 80},
             {id:"red", percent: 40},
             {id:"blue", percent: 10}];

var d3Rings = [];

var convertPercentToAngle = (percent) => { return ( percent / 100 ) * pie };

var createRings = function(){

  rings.map(function(ring,index){

    	var d3Ring = svg
                .append("g")
                  .attr("transform", "translate(" + width / 2 + "," + ( ( 100 * index ) + 50 ) + ")")
                  .attr("id",ring.id);
    // background
    d3Ring
    .append("path")
    .datum({endAngle: pie})
    .style("fill", "#ddd")
    .attr("d", arc);

    // foreground
    var foreground = d3Ring
    .append("path")
    .datum({endAngle: 0})
    .style("fill", ring.id)
		.style("stroke", "none")
		.style("stroke-width", "0px")
		.style("opacity", 1)
    .attr("d", arc);

    // text
    d3Ring
  	.append("text")
  	.attr("x", -22)
    .attr("y", 8)
    .text(ring.percent + "%")
		.attr("class", ring.id);


    var angle = convertPercentToAngle(ring.percent);

    foreground
    .transition()
      .duration(1500)
			.delay(500 * index)
      .call(arcTween, angle);

    d3Rings.push(d3Ring);

  });
}

createRings();

function arcTween(transition, newAngle) {

  transition.attrTween("d", function(d) {
  var interpolate = d3.interpolate(d.endAngle, newAngle);

    return function(t) {
      d.endAngle = interpolate(t);
      return arc(d);
    };
  });
}

</script>
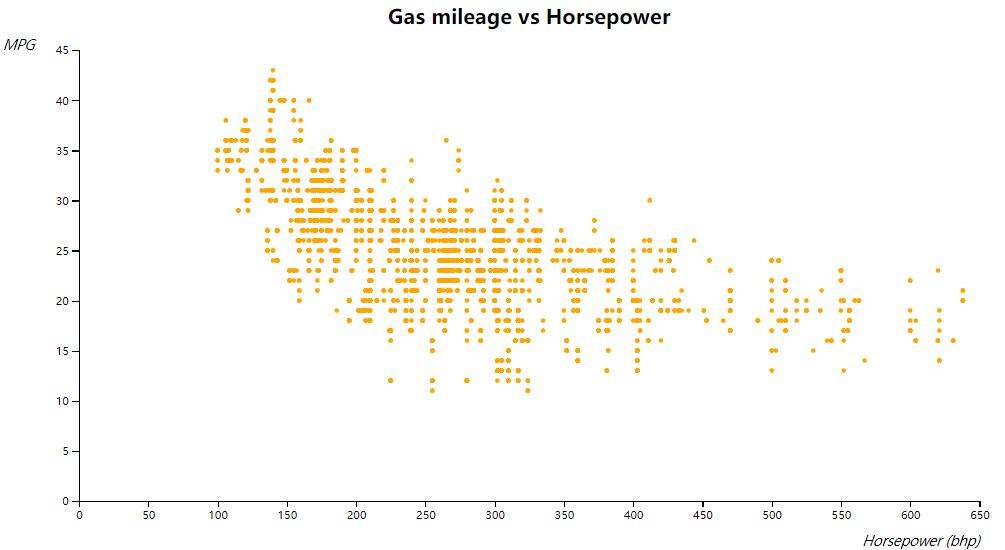
# 散点图实例
<!DOCTYPE html>
<html lang="en">
<head>
	<meta charset="utf-8">
	<title>Scatterplot bivariate</title>
	<script src="https://d3js.org/d3.v5.min.js"></script>
	<style type="text/css">
	.axis path,
	.axis line {
		fill: none;
		stroke: #000;
		shape-rendering: crispEdges;
	}

	.dot {
		stroke: #000;
	}


</style>
</head>
<body>
	<script type="text/javascript">
		// Adapted from
		// https://bl.ocks.org/mbostock/3887118

		const w = 800;
		const h = 400;

		const xScale = d3.scaleLinear().range([0, w]);
		const yScale = d3.scaleLinear().range([h, 0]);

		const xAxis = d3.axisBottom(xScale);
		const yAxis = d3.axisLeft(yScale);

		var svg = d3
		.select("body")
		.append("svg")
		.attr("width", w + 100)
		.attr("height", h + 100)
		.append("g")
		.attr("transform", "translate(" + 80 + "," + 50 +")"); // margins

		svg.append("text")
		.attr("x", w/2)
		.attr("y", -30)
		.attr("dy", ".35em")
		.attr("font-size", 18)
		.attr("font-weight", "bold")
		.attr("fill", "black")
		.style("text-anchor", "middle")
		.text("Gas mileage vs Horsepower");

		d3.csv("a.csv", d => ({
			CityMpg: parseInt(d.CityMpg),
			Classification: d.Classification,
			Driveline: d.Driveline,
			EngineType: d.EngineType,
			FuelType: d.FuelType,
			Height: parseInt(d.Height),
			HighwayMpg: parseInt(d.HighwayMpg),
			Horsepower: parseInt(d.Horsepower),
			Hybrid: d.Hybrid,
			ID: d.ID,
			Length: parseInt(d.Length),
			Make: d.Make,
			ModelYear: d.ModelYear,
			ForwardGears: parseInt(d.ForwardGears),
			Torque: parseInt(d.Torque),
			Transmission: d.Transmission,
			Width: parseInt(d.Width),
			Year: parseInt(d.Year)
		}))
		.then(cars => {

			// Rescale based on data
			const maxHorsepower = d3.max(cars.map(car => car.Horsepower));
			xScale.domain([0, maxHorsepower]).nice();

			const maxMpg = d3.max(cars.map(car => car.HighwayMpg));
			yScale.domain([0, maxMpg]).nice();


			// X axis path+ticks
			svg.append("g")
			.attr("class", "x axis")
			.attr("transform", "translate(0, " + h +")")
			.call(xAxis);

			// X axis legend
			svg.append("g")
			.append("text")
			.attr("class", "label")
			.attr("x", w)
			.attr("y", h+40)
			.attr("font-size", 12)
			.attr("font-style", "italic")
			.style("text-anchor", "end")
			.text("Horsepower (bhp)");

			// Y axis path+ticks
			svg.append("g")
			.attr("class", "y axis")
			.call(yAxis);

			// Y axis label
			svg.append("g")
			.append("text")
			.attr("class", "label")
			.attr("x", -40)
			.attr("y", 0)
			.attr("font-size", 12)
			.attr("font-style", "italic")
			.style("text-anchor", "end")
			.text("MPG");

			// Data points
			// Note you might see ghost lines, that's an optical illusion.
			svg.append("g")
			.selectAll(".dot")
			.data(cars)
			.enter()
			.append("circle")
			.attr("r", 2)
			.attr("cx", d => xScale(d.Horsepower))
			.attr("cy", d => yScale(d.HighwayMpg))
			.style("fill", "orange");

		})
		;
	</script>
</body>
</html>
CityMpg,Classification,Driveline,EngineType,FuelType,Height,HighwayMpg,Horsepower,Hybrid,ID,Length,Make,ModelYear,ForwardGears,Torque,Transmission,Width,Year
18,Automatic transmission,All-wheel drive,Audi 3.2L 6 cylinder 250hp 236ft-lbs,Gasoline,140,25,250,False,2009 Audi A3 3.2,143,Audi,2009 Audi A3,6,236,6 Speed Automatic Select Shift,202,2009
22,Automatic transmission,Front-wheel drive,Audi 2.0L 4 cylinder 200 hp 207 ft-lbs Turbo,Gasoline,140,28,200,False,2009 Audi A3 2.0 T AT,143,Audi,2009 Audi A3,6,207,6 Speed Automatic Select Shift,202,2009
21,Manual transmission,Front-wheel drive,Audi 2.0L 4 cylinder 200 hp 207 ft-lbs Turbo,Gasoline,140,30,200,False,2009 Audi A3 2.0 T,143,Audi,2009 Audi A3,6,207,6 Speed Manual,202,2009
21,Automatic transmission,All-wheel drive,Audi 2.0L 4 cylinder 200 hp 207 ft-lbs Turbo,Gasoline,140,28,200,False,2009 Audi A3 2.0 T Quattro,143,Audi,2009 Audi A3,6,207,6 Speed Automatic Select Shift,202,2009
21,Automatic transmission,All-wheel drive,Audi 2.0L 4 cylinder 200 hp 207 ft-lbs Turbo,Gasoline,140,28,200,False,2009 Audi A3 2.0 T Quattro,143,Audi,2009 Audi A3,6,207,6 Speed Automatic Select Shift,202,2009
16,Manual transmission,All-wheel drive,Audi 3.2L 6 cylinder 265hp 243 ft-lbs,Gasoline,91,27,265,False,2009 Audi A5 3.2,17,Audi,2009 Audi A5,6,243,6 Speed Manual,62,2009
17,Automatic transmission,All-wheel drive,Audi 3.2L 6 cylinder 265hp 243 ft-lbs,Gasoline,91,26,265,False,2009 Audi A5 3.2 AT,17,Audi,2009 Audi A5,6,243,6 Speed Automatic Select Shift,62,2009
13,Automatic transmission,All-wheel drive,Audi 4.2L 8 cylinder 350 hp 325 ft-lbs,Gasoline,201,18,350,False,2009 Audi Q7 4.2,221,Audi,2009 Audi Q7,6,325,6 Speed Automatic Select Shift,191,2009
14,Automatic transmission,All-wheel drive,Audi 3.6L 6 cylinder 280hp 266 ft-lbs,Gasoline,201,20,280,False,2009 Audi Q7 3.6,221,Audi,2009 Audi Q7,6,266,6 Speed Automatic Select Shift,191,2009
22,Manual transmission,All-wheel drive,Audi 2.0L 4 cylinder 211 hp 258 ft-lbs Turbo,Gasoline,147,30,211,False,2009 Audi A4 Sedan 2.0 T Quattro,96,Audi,2009 Audi A4 Sedan,6,258,6 Speed Manual,34,2009
21,Automatic transmission,All-wheel drive,Audi 2.0L 4 cylinder 211 hp 258 ft-lbs Turbo,Gasoline,147,27,211,False,2009 Audi A4 Sedan 2.0 T Quattro AT,96,Audi,2009 Audi A4 Sedan,6,258,6 Speed Automatic Select Shift,34,2009
17,Automatic transmission,All-wheel drive,Audi 3.2L 6 cylinder 265hp 243 ft-lbs,Gasoline,147,26,265,False,2009 Audi A4 Sedan 3.2,96,Audi,2009 Audi A4 Sedan,6,243,6 Speed Automatic Select Shift,34,2009
20,Automatic transmission,Front-wheel drive,Acura 3.5L 6 Cylinder 280 hp 254 ft-lbs,Gasoline,172,29,280,False,2012 Acura TL,63,Acura,2012 Acura TL,6,254,6 Speed Automatic Select Shift,87,2012
18,Automatic transmission,All-wheel drive,Acura 3.7L 6 Cylinder 305 hp 273 ft-lbs,Gasoline,172,26,305,False,2012 Acura TL SH-AWD,63,Acura,2012 Acura TL,6,273,6 Speed Automatic Select Shift,87,2012
12,Automatic transmission,All-wheel drive,BMW 4.4L 8 cylinder 555hp 500 ft-lbs Turbo,Gasoline,226,17,555,False,2010 BMW X5 M SUV,243,BMW,2010 BMW X5,6,500,6 Speed Automatic Select Shift,201,2010
12,Automatic transmission,All-wheel drive,BMW 4.4L 8 cylinder 555hp 500 ft-lbs Turbo,Gasoline,226,17,555,False,2011 BMW X5 M SUV,243,BMW,2011 BMW X5,6,500,6 Speed Automatic Select Shift,201,2011
12,Automatic transmission,All-wheel drive,BMW 4.4L 8 cylinder 555hp 500 ft-lbs Turbo,Gasoline,148,17,555,False,2010 BMW X6 M,12,BMW,2010 BMW X6,6,500,6 Speed Automatic Select Shift,191,2010
12,Automatic transmission,All-wheel drive,BMW 4.4L 8 cylinder 555hp 500 ft-lbs Turbo,Gasoline,148,17,555,False,2011 BMW X6 M,12,BMW,2011 BMW X6,6,500,6 Speed Automatic Select Shift,191,2011
18,Manual transmission,Rear-wheel drive,Chevrolet 2.9L 4 Cylinder 185 hp 190 ft-lbs,Gasoline,112,25,185,False,2012 Chevrolet Colorado Work Truck,22,Chevrolet,2012 Chevrolet Colorado,5,190,5 Speed Manual,181,2012
18,Manual transmission,Rear-wheel drive,Chevrolet 2.9L 4 Cylinder 185 hp 190 ft-lbs,Gasoline,112,25,185,False,2012 Chevrolet Colorado Extended Cab Work Truck,140,Chevrolet,2012 Chevrolet Colorado,5,190,5 Speed Manual,181,2012
18,Automatic transmission,Rear-wheel drive,Chevrolet 2.9L 4 Cylinder 185 hp 190 ft-lbs,Gasoline,120,25,185,False,2012 Chevrolet Colorado Crew Cab 1LT,140,Chevrolet,2012 Chevrolet Colorado,4,190,4 Speed Automatic,181,2012
18,Manual transmission,Rear-wheel drive,Chevrolet 2.9L 4 Cylinder 185 hp 190 ft-lbs,Gasoline,112,25,185,False,2011 Chevrolet Colorado Work Truck,22,Chevrolet,2011 Chevrolet Colorado,5,190,5 Speed Manual,181,2011
18,Manual transmission,Rear-wheel drive,Chevrolet 2.9L 4 Cylinder 185 hp 190 ft-lbs,Gasoline,112,25,185,False,2011 Chevrolet Colorado Extended Cab Work Truck,140,Chevrolet,2011 Chevrolet Colorado,5,190,5 Speed Manual,181,2011

20,Automatic transmission,Rear-wheel drive,Hyundai 2.0L 4 Cylinder 210 hp 223 ft-lbs Turbo,Gasoline,104,30,210,False,2011 Hyundai Genesis Coupe 2.0T Premium,22,Hyundai,2011 Hyundai Genesis Coupe,5,223,5 Speed Automatic Select Shift,72,2011
17,Automatic transmission,Rear-wheel drive,Hyundai 3.8L 6 Cylinder 306 hp 266 ft-lbs,Gasoline,104,27,306,False,2011 Hyundai Genesis Coupe 3.8 Grand Touring,22,Hyundai,2011 Hyundai Genesis Coupe,6,266,6 Speed Automatic Select Shift,72,2011
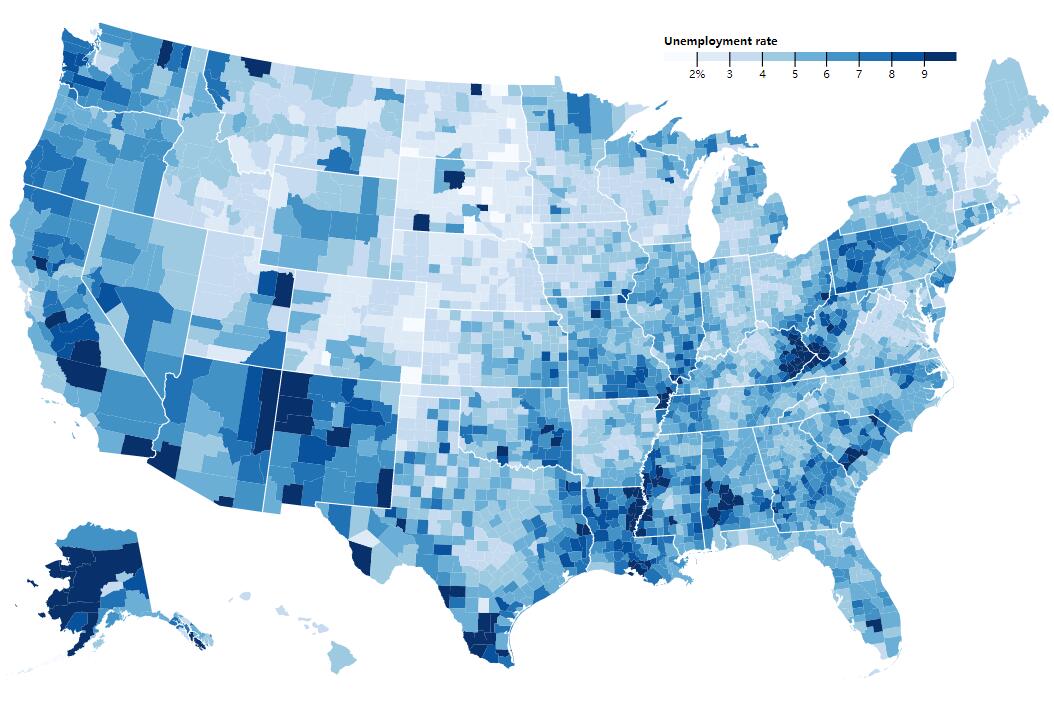
# 美国地图实例
<!DOCTYPE html>
<meta charset="utf-8">
<style>

.counties {
  fill: none;
}

.states {
  fill: none;
  stroke: #fff;
  stroke-linejoin: round;
}

</style>
<svg width="960" height="600"></svg>
<script src="https://d3js.org/d3.v5.min.js"></script>
<!-- <script src="https://d3js.org/d3-scale-chromatic.v1.min.js"></script> -->
<script src="https://d3js.org/topojson.v2.min.js"></script>
<script>

var svg = d3.select("svg"),
    width = +svg.attr("width"),
    height = +svg.attr("height");

var path = d3.geoPath();

var x = d3.scaleLinear()
    .domain([1, 10])
    .rangeRound([600, 860]);

var color = d3.scaleThreshold()
    .domain(d3.range(2, 10))
    .range(d3.schemeBlues[9]);

var g = svg.append("g")
    .attr("class", "key")
    .attr("transform", "translate(0,40)");

g.selectAll("rect")
  .data(color.range().map(function(d) {
      d = color.invertExtent(d);
      if (d[0] == null) d[0] = x.domain()[0];
      if (d[1] == null) d[1] = x.domain()[1];
      return d;
    }))
  .enter().append("rect")
    .attr("height", 8)
    .attr("x", function(d) { return x(d[0]); })
    .attr("width", function(d) { return x(d[1]) - x(d[0]); })
    .attr("fill", function(d) { return color(d[0]); });

g.append("text")
    .attr("class", "caption")
    .attr("x", x.range()[0])
    .attr("y", -6)
    .attr("fill", "#000")
    .attr("text-anchor", "start")
    .attr("font-weight", "bold")
    .text("Unemployment rate");

g.call(d3.axisBottom(x)
    .tickSize(13)
    .tickFormat(function(x, i) { return i ? x : x + "%"; })
    .tickValues(color.domain()))
  .select(".domain")
    .remove();

var promises = [
  d3.json("https://d3js.org/us-10m.v1.json"),
  d3.tsv("./data.tsv")
]
//
Promise.all(promises).then(ready)

function ready([us, unemployment]) {
  var data = {};
  unemployment.forEach(function(d){
    data[d.id] = d.rate;
  });

  svg.append("g")
      .attr("class", "counties")
    .selectAll("path")
    	.data(topojson.feature(us, us.objects.counties).features)
    .enter().append("path")
      .attr("fill", function(d) { return color(d.rate = data[d.id]) })
      .attr("d", path)
    .append("title")
      .text(function(d) { return d.rate + "%"; });

  svg.append("path")
      .datum(topojson.mesh(us, us.objects.states, function(a, b) { return a !== b; }))
      .attr("class", "states")
      .attr("d", path);
}

</script>
id	rate
01001	5.1
01003	4.9
01005	8.6
01007	6.2
01009	5.1
01011	7.1
01013	6.7
01015	6.1
01017	5.0
01019	5.0
01021	5.2